
Syndication of Article Allowed With Citation To This Original Article
Least Affordable Cities Among Major Cities
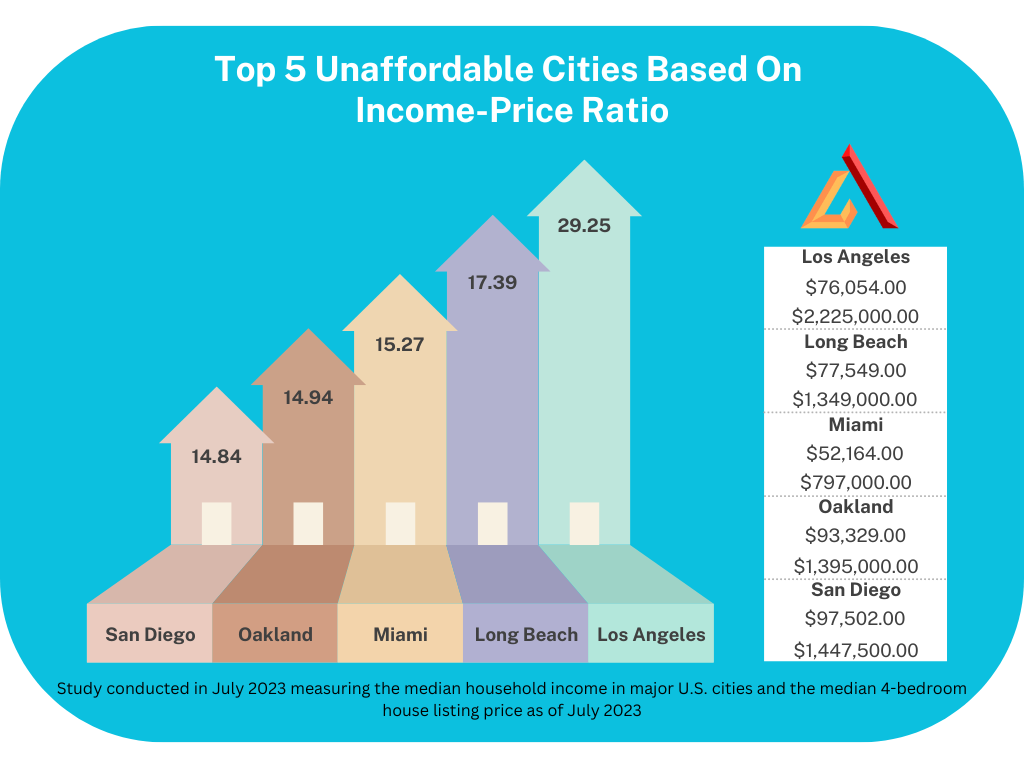
Airdeed Homes’ study of housing affordability among the top 50 major cities reveals significant housing disparities across the United States. Among the cities examined, Los Angeles and Miami stand out as particularly unaffordable, with skyrocketing housing prices that far exceed the national average. Long Beach and San Diego also face similar challenges, as they struggle to provide affordable housing options for their residents. Seattle, Denver, Houston, Nashville and Boston were excluded due to lack of available data.
10 Least Affordable Major Cities


Los Angeles Housing Affordability
The housing affordability in Los Angeles is a significant concern, as the price-to-income ratio for both 4-bedroom and 3-bedroom homes is considerably higher than the national average. With a median household income of $76,054, the median listing price for 4-bedroom homes in Los Angeles is $2,225,000, resulting in a price-to-income ratio of 29.25. Similarly, the median listing price for a 3-bedroom home is $1,375,000, leading to a price-to-income ratio of 18.07. These high price-to-income ratios indicate that many residents in Los Angeles struggle to afford housing, leading to a housing crisis in the city.
Long Beach Housing Affordability
Long Beach, a city known for its diverse population and vibrant coastal lifestyle, presents a complex landscape when it comes to the accessibility of its housing market. The median home listing price for 4-bedroom houses in Long Beach is $1,349,000, which is significantly higher than the median household income of $77,549. This high price to income ratio of 17.39 indicates that owning a 4-bedroom home in Long Beach may be out of reach for many residents. On the other hand, the median home listing price for a 3-bedroom house is $927,000, with a price to income ratio of 11.95. While this is a more affordable option compared to the 4-bedroom homes, it still poses challenges for those looking to enter the housing market.
Miami Housing Affordability
Miami, a popular coastal city in Florida, exhibits a notable disparity between the median household income and the listing prices of both 4-bedroom and 3-bedroom homes in Miami. The median household income in Miami is $52,164, while the listing price for a 4-bedroom home is $797,000, resulting in a price to income ratio of 15.27. Similarly, the listing price for a 3-bedroom home is $588,990, with a price to income ratio of 11.29. These figures indicate that owning a home in Miami may be financially challenging for the average household.
Oakland Housing Affordability
Oakland, a vibrant city in California, presents a significant contrast between the median household income and the listing prices of Oakland homes, indicating potential challenges for prospective homeowners. With a median household income of $93,329 and a 4-bedroom median home listing price of $1,395,000, the price to income ratio stands at 14.94, signaling a housing affordability crisis. The situation is not much better for 3-bedroom homes, with a median listing price of $1,086,950 and a price to income ratio of 11.64. These numbers highlight the growing disparity between income levels and housing costs in Oakland.
San Diego Housing Affordability
San Diego, a vibrant city in Southern California, presents a significant contrast between the median household income and the listing prices of homes, indicative of potential challenges for prospective homeowners. The San Diego housing market is characterized by high housing prices, making it difficult for residents to afford homes. The median listing price for a 4-bedroom home in San Diego is $1,447,500, which is approximately 14.85 times the median household income of $97,502. Similarly, the median listing price for a 3-bedroom home is $980,000, which is about 10.05 times the median household income. This disparity suggests a housing shortage in San Diego and raises concerns about the affordability of housing in the city.
San Jose Housing Affordability
With a robust economy and a high cost of living, San Jose presents a challenging housing market for its residents. The housing prices in San Jose are significantly higher compared to the median household income, making affordable housing a major concern. The median home listing price for a 4-bedroom house is $1,849,000, which is more than 13 times the median household income of $136,324. Similarly, the median home listing price for a 3-bedroom house is $1,262,475, which is around 9 times the median household income. This substantial price to income ratio indicates the unaffordability of housing in San Jose.
San Francisco Housing Affordability
Despite its reputation as a desirable city in terms of lifestyle and opportunities, San Francisco’s housing market poses significant challenges for its residents. The city’s high housing prices have made it increasingly difficult for individuals and families to find affordable housing options. The median home listing price for a 4-bedroom property in San Francisco is a staggering $1,854,444, while the median household income is $137,536, resulting in a price to income ratio of 13.48. Similarly, the median home listing price for a 3-bedroom property is $1,535,000, with a price to income ratio of 11.16.
Tampa Housing Affordability
Tampa’s housing market presents significant challenges for its residents given the wide disparity between median household income and the high prices of 4-bedroom and 3-bedroom Tampa houses. The Tampa housing market trends reflect a growing demand for housing, which has led to an increase in home prices. With a median household income of $65,280.00 and a 4-bedroom median home listing price of $825,000.00, the price to income ratio stands at 12.63, indicating a lack of affordability. The 3-bedroom median home listing price of $550,000.00 is slightly better, with a price to income ratio of 8.42.
New York Housing Affordability
New York City’s housing market presents significant challenges for its residents due to the wide disparity between median household income and the high prices of homes. With a median household income of $77,018.00 and a 4-bedroom median home listing price of $948,000.00, the price to income ratio stands at 12.30, indicating a lack of affordability. The 3-bedroom median home listing price of $739,000.00 also contributes to this issue, with a price to income ratio of 9.59. New York City comprises five boroughs: Brooklyn, Queens, Manhattan, the Bronx, and Staten Island.
Tucson Housing Affordability
Tucson’s housing market poses significant challenges for its residents, with a wide disparity between median household income and the high prices of homes. The median household income in Tucson is $52,380, while the median listing price for a 4-bedroom home is $639,990, resulting in a price-to-income ratio of 12.21. While the median listing price for a 3-bedroom Tucson home is $590,99.00, with a price-to-income ratio of 11.28. This indicates that housing affordability is a major concern for Tucson residents.
Full Housing Affordability Chart
| City | Household Income | 4-Bedroom Price | Ratio | 3-Bedroom Price | Ratio |
|---|---|---|---|---|---|
| Fort Worth | $74,036.00 | $389,900.00 | 5.266356907 | $325,999.00 | 4.40324977 |
| Wichita | $61,444.00 | $325,000.00 | 5.289369182 | $254,900.00 | 4.148492937 |
| Chicago | $71,697.00 | $394,900.00 | 5.507901307 | $420,000.00 | 5.85798569 |
| Philadelphia | $57,384.00 | $319,900.00 | 5.574724662 | $239,000.00 | 4.164924021 |
| Virginia Beach | $89,168.00 | $500,360.00 | 5.611430109 | $380,000.00 | 4.261618518 |
| San Antonio | $60,038.00 | $339,950.00 | 5.662247243 | $280,000.00 | 4.663712982 |
| Jacksonville | $63,503.00 | $368,900.00 | 5.80917437 | $299,000.00 | 4.708438971 |
| Oklahoma City | $65,046.00 | $378,200.00 | 5.81434677 | $267,000.00 | 4.104787381 |
| Columbus | $63,843.00 | $375,000.00 | 5.873784127 | $292,400.00 | 4.579985276 |
| Louisville | $63,605.00 | $379,954.00 | 5.97364987 | $265,000.00 | 4.166339124 |
| El Paso | $55,941.00 | $334,975.00 | 5.98800522 | $267,000.00 | 4.772885719 |
| Indianapolis | $59,206.00 | $359,947.50 | 6.079578083 | $237,000.00 | 4.002972672 |
| Baltimore | $58,992.00 | $369,000.00 | 6.255085435 | $364,900.00 | 6.185584486 |
| Bakersfield | $75,221.00 | $474,500.00 | 6.308078861 | $419,490.00 | 5.576767126 |
| Detroit | $37,888.00 | $249,000.00 | 6.572001689 | $220,000.00 | 5.806587838 |
| Charlotte | $74,516.00 | $497,469.50 | 6.676009179 | $385,000.00 | 5.166675613 |
| Omaha | $71,237.00 | $480,000.00 | 6.738071508 | $349,495.00 | 4.906088128 |
| Milwaukee | $49,394.00 | $346,950.00 | 7.024132486 | $299,000.00 | 6.053366806 |
| Memphis | $47,936.00 | $349,900.00 | 7.299315754 | $187,500.00 | 3.911465287 |
| Colorado Springs | $78,429.00 | $585,000.00 | 7.458975634 | $464,950.00 | 5.928291831 |
| Kansas City | $65,442.00 | $499,950.00 | 7.639589255 | $365,000.00 | 5.577457902 |
| Raleigh | $79,561.00 | $625,000.00 | 7.855607647 | $386,125.00 | 4.853194404 |
| Atlanta | $75,384.00 | $599,000.00 | 7.945983233 | $525,000.00 | 6.964342566 |
| Tulsa | $57,154.00 | $459,500.00 | 8.039682262 | $412,500.00 | 7.217342618 |
| Minneapolis | $76,403.00 | $637,875.00 | 8.348821381 | $749,950.00 | 9.815714043 |
| Mesa | $71,636.00 | $599,850.00 | 8.373583115 | $549,950.00 | 7.677005975 |
| Austin | $86,067.00 | $725,000.00 | 8.423669932 | $525,000.00 | 6.099898916 |
| Fresno | $62,356.00 | $536,900.00 | 8.610237988 | $507,490.00 | 8.138591314 |
| Portland | $85,534.00 | $739,950.00 | 8.650945823 | $549,000.00 | 6.418500246 |
| Las Vegas | $66,874.00 | $589,450.00 | 8.814337411 | $425,000.00 | 6.355235218 |
| Albuquerque | $61,435.00 | $548,640.00 | 8.930414259 | $513,500.00 | 8.358427606 |
| Dallas | $63,468.00 | $576,385.00 | 9.081505641 | $430,000.00 | 6.775067751 |
| Sacramento | $77,466.00 | $709,044.00 | 9.152970335 | $578,945.00 | 7.473536777 |
| Phoenix | $70,766.00 | $710,000.00 | 10.03306673 | $495,450.00 | 7.001243535 |
| Tucson | $52,380.00 | $639,990.00 | 12.21821306 | $590,990.00 | 11.2827415 |
| New York | $77,018.00 | $948,000.00 | 12.30881093 | $739,000.00 | 9.595159573 |
| Tampa | $65,280.00 | $825,000.00 | 12.63786765 | $550,000.00 | 8.425245098 |
| San Francisco | $137,536.00 | $1,854,444.00 | 13.48333527 | $1,535,000.00 | 11.16071429 |
| San Jose | $136,324.00 | $1,849,000.00 | 13.56327573 | $1,262,475.00 | 9.260841818 |
| San Diego | $97,502.00 | $1,447,500.00 | 14.84584932 | $980,000.00 | 10.05107588 |
| Oakland | $93,329.00 | $1,395,000.00 | 14.94712254 | $1,086,950.00 | 11.64643358 |
| Miami | $52,164.00 | $797,000.00 | 15.27873629 | $588,990.00 | 11.29112031 |
| Long Beach | $77,549.00 | $1,349,000.00 | 17.3954532 | $927,000.00 | 11.95373248 |
| Los Angeles | $76,054.00 | $2,225,000.00 | 29.25552897 | $1,375,000.00 | 18.07925947 |